Rancher’s Load Balancer service is pretty awesome - right out of the box it automatically updates the HAProxy configuration based on what’s happening with the containers.
But, how do you collect metrics so you can watch the performances? It’s not immediately obvious and even less if you are running a High-availability load balancer service.
Here is how this can be achieved.
Configuring the load balancer service
In more recent versions, Rancher has an option where you can enter some custom configuration snippets. Using this, putting the following in the global configuration section enables the statistics endpoint of HAProxy.
listen stats
bind 0.0.0.0:9000
mode http
stats enable
stats hide-version
stats realm Haproxy\ Statistics
stats uri /haproxy_stats
Networking
With Rancher, the containers in an environment have network access to other
containers, even if the port is not officially exposed. So in the configuration
above, HAProxy will be listening on port 9000 but this is only available
through the internal container network set up by Rancher.
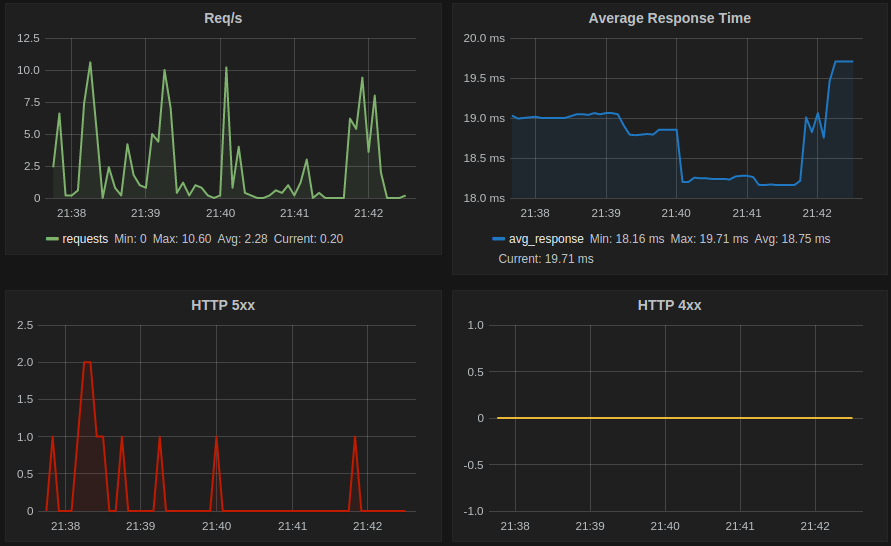
At this point, all you need is some software that will collect the metrics and send them to some storage.
But how to do address the load balancer container? If you run only 1 container
instance, that’s not a problem. You can access it through the service name.
That is, if you named your load balancer service “lb”, then you can configure
your collector to pull from http://lb:9000/haproxy_stats. Great!
Oh wait, I am running 2 container instances for redundancy… not a problem, at
least in version 0.63.0 of Rancher - the addressing is only slightly different.
With more than 1 container instance, you have to address the containers directly, because if you address the service, you’ll get a round-robin DNS response - sometimes you’ll get instance #1, others instance #2.
In 0.63.0, you can now address the container in the form <instance-name>.<service-name>.<stack-name>.
So if your service name is lb and your stack name is mystack, you can address
the 2 individual containers like this:
http://mystack_lb_1.lb.mystack:9000/haproxy_statshttp://mystack_lb_2.lb.mystack:9000/haproxy_stats
Using Telegraf
I like the Telegraf -> InfluxDB -> Grafana stack. Telegraf can be configured easily. I won’t cover the whole Telegraf configuration, but here is an example input configuration for it:
[[inputs.haproxy]]
  servers = ["http://mystack_lb_1.lb.mystack:9000/haproxy_stats;csv", "http://mystack_lb_2.lb.mystack:9000/haproxy_stats;csv"]
Now you can create a container with this example Dockerfile:
FROM buildpack-deps:jessie-curl
CMD [ "telegraf", "-config", "/etc/telegraf.conf" ]
RUN   curl --insecure -Lo /tmp/telegraf.deb http://get.influxdb.org/telegraf/telegraf_0.11.1-1_amd64.deb && \
      dpkg -i /tmp/telegraf.deb && \
      rm -f /tmp/telegraf.deb
ADD telegraf.conf /etc/telegraf.conf
Deploy this container through Rancher - you only need to run one instance. And voila! You have some metrics being recorded in InfluxDB for your Load Balancer.